Uncategorized files
Jump to navigation
Jump to search
Showing below up to 50 results in range #101 to #150.
View (previous 50 | next 50) (20 | 50 | 100 | 250 | 500)
- Fig. 12. Back end synergistic case in the global scenario..png 921 × 704; 154 KB
- Fig. 12. Performance and ranking results for advanced NFC options..png 3,754 × 1,173; 713 KB
- Fig. 13. Long term storages of LWR SNF in NG1 (synergistic case).png 675 × 441; 66 KB
- Fig. 14. Levelized fuel cycle unit costs..png 1,333 × 675; 63 KB
- Fig. 2. Overall view of the considered synergies among the technologies..png 1,386 × 922; 180 KB
- Fig. 2. Schematics of MAVT..png 852 × 342; 55 KB
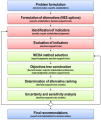
- Fig. 3. Flowchart of MCDA application..png 509 × 607; 115 KB
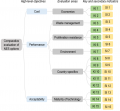
- Fig. 4. Schematics of the objectives tree..png 863 × 797; 133 KB
- Fig. 5. Inputs of KIND-ET (example)..png 868 × 322; 106 KB
- Fig. 6. Outputs of KIND-ET (example)..png 906 × 465; 215 KB
- Fig. 6 Cumulative spent fuel accumulation in two scenarios..png 1,019 × 332; 82 KB
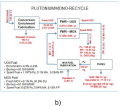
- Fig. 7b SYNEGRIES.png 478 × 427; 172 KB
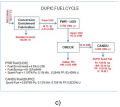
- Fig. 7c SYNERGIES.png 478 × 427; 131 KB
- Fig. 7d SYNERGIES.png 478 × 427; 167 KB
- Fig. 7e SYNERGIES.png 488 × 427; 188 KB
- Fig. 9. Scheme of regional collaboration on spent nuclear fuel utilization..png 1,920 × 1,080; 101 KB
- Gongshi1.png 606 × 47; 2 KB
- Gongshi2and3.png 607 × 84; 3 KB
- Gongshi4.png 606 × 33; 2 KB
- Gongshi5.png 82 × 56; 1 KB
- Gongshi6.png 185 × 43; 2 KB
- IAEA Logo.png 80 × 100; 3 KB
- INPRO Sub-Logo blue.png 150 × 66; 10 KB
- INPRO Sustainability Assessment Menu.png 1,227 × 742; 148 KB
- INPRO hierarchy of demands.png 2,062 × 1,157; 519 KB
- Image00003.png 869 × 867; 130 KB
- Image001.png 894 × 731; 144 KB
- Image003.png 540 × 547; 154 KB
- Image005.png 2,014 × 1,544; 1.6 MB
- Image007.png 1,710 × 731; 96 KB
- Image009.png 1,291 × 586; 69 KB
- Image011.png 1,065 × 725; 55 KB
- Image013.png 902 × 290; 24 KB
- Image015.png 647 × 361; 32 KB
- Image017.png 912 × 286; 21 KB
- Image019.png 568 × 326; 26 KB
- Image021.png 945 × 373; 59 KB
- Image023.png 946 × 351; 39 KB


