Gallery of new files
Jump to navigation
Jump to search
This special page shows the last uploaded files.
- FIG. 12. Plutonium in short-term cooled SNF for the moderate GAINS scenario..png SHIROKIYD
09:25, 24 August 2020
443 × 341; 44 KB
- FIG. 11. Potential for fast reactor deployment..png SHIROKIYD
09:23, 24 August 2020
622 × 470; 55 KB
- FIG. 10. Cumulative amounts of spent fuel in BAU(a) and BAU&FR (b) systems for the high GAINS scenario..png SHIROKIYD
09:21, 24 August 2020
984 × 406; 43 KB
- FIG. 9. Cumulative natural uranium demand in BAU (a) and BAU&FR (b) systems for the high GAINS scenario..png SHIROKIYD
09:18, 24 August 2020
1,045 × 429; 72 KB
- FIG. 8. Power production growth for BAU (a) and BAU&FR systems (b)..png SHIROKIYD
09:15, 24 August 2020
1,212 × 446; 34 KB
- FIG. 7. Flow chart for a combined once-through cycle and fast reactor closed fuel cycle system.png SHIROKIYD
14:13, 21 August 2020
948 × 574; 66 KB
- FIG. 6. Variation in technical maturity for reactor designs in the GAINS database.png SHIROKIYD
14:00, 21 August 2020
928 × 920; 988 KB
- FIG. 4. Heterogeneous models for future global nuclear fuel cycles..png SHIROKIYD
13:50, 21 August 2020
554 × 192; 16 KB
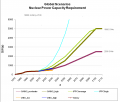
- FIG. 3. GAINS scenarios for modelling nuclear power generation (GWa values show actual electric power produced annually, not installed capacity)..png SHIROKIYD
13:48, 21 August 2020
1,044 × 891; 51 KB
- FIG. 2. Set of reactor and fuel types with deployment time frames..jpg SHIROKIYD
13:44, 21 August 2020
1,162 × 818; 141 KB
- FIG.1. 5th Meeting of the INPRO Collaborative Project GAINS, 27 May 2010..jpg SHIROKIYD
13:41, 21 August 2020
1,258 × 829; 242 KB
- Fig. 18. Pu and MA inventories in disposal facilities at the end of scenario cycle..png SHIROKIYD
12:41, 21 August 2020
1,368 × 682; 38 KB
- Fig. 16. The minimum required averted disposal costs of HLW for each storage duration and REPU enrichment..png SHIROKIYD
12:38, 21 August 2020
812 × 342; 16 KB
- Fig. 15. The value of reprocessed uranium as a function of the cost of natural uranium, with fabrication costs held fixed.png SHIROKIYD
12:37, 21 August 2020
769 × 395; 75 KB
- Fig. 13. Long term storages of LWR SNF in NG1 (synergistic case).png SHIROKIYD
12:35, 21 August 2020
675 × 441; 66 KB
- Fig. 12. Back end synergistic case in the global scenario..png SHIROKIYD
12:34, 21 August 2020
921 × 704; 154 KB
- Fig. 10. French scenario- (a) First step, (b) Second step of transition to the NES based on closed nuclear fuel cycle..png SHIROKIYD
12:33, 21 August 2020
811 × 155; 8 KB
- Fig. 9. Scheme of regional collaboration on spent nuclear fuel utilization..png SHIROKIYD
12:30, 21 August 2020
1,920 × 1,080; 101 KB
- Fig. 8 Comparison of the amounts of spent nuclear fuel in interim storage in the two EU27 scenarios..png SHIROKIYD
12:29, 21 August 2020
727 × 298; 65 KB
- Fig. 6 Cumulative spent fuel accumulation in two scenarios..png SHIROKIYD
10:08, 21 August 2020
1,019 × 332; 82 KB
- Fig. 5. Fresh fuel annual requirements (left) and cumulative spent fuel in storages (right)..png SHIROKIYD
10:07, 21 August 2020
848 × 332; 74 KB
- Fig. 4. CAREM - small PWR reactor of Argentinian design of 25 MWe capacity..jpg SHIROKIYD
10:02, 21 August 2020
800 × 376; 145 KB
- Fig. 3. Nature of synergies within the SYNERGIES storyline (the lower bar shows the degree of technological readiness in conventional units (18))..png SHIROKIYD
09:59, 21 August 2020
945 × 445; 90 KB
- Fig. 2. Overall view of the considered synergies among the technologies..png SHIROKIYD
09:53, 21 August 2020
1,386 × 922; 180 KB
- FIG. 6. Flowchart of uranium refining and conversion..png SHIROKIYD
07:26, 6 August 2020
613 × 225; 14 KB
- FIG. 25. Fuel production chain for a light water reactor using uranium fuel in an open fuel cycle..jpg SHIROKIYD
08:18, 5 August 2020
1,110 × 253; 72 KB
- FIG. 21d. Power generation for different types of reactors and groups in the BAU+–FR.png SHIROKIYD
14:04, 4 August 2020
596 × 387; 25 KB
- FIG. 21c. Power generation for different types of reactors and groups in the BAU+–FR.png SHIROKIYD
14:04, 4 August 2020
631 × 411; 35 KB
- FIG. 21b. Power generation for different types of reactors and groups in the BAU+–FR.png SHIROKIYD
14:03, 4 August 2020
665 × 428; 35 KB
- FIG. 21a. Power generation for different types of reactors and groups in the BAU+–FR.png SHIROKIYD
14:03, 4 August 2020
604 × 446; 37 KB
- FIG. 19b. Power generation for different reactor types in the BAU.png SHIROKIYD
13:57, 4 August 2020
631 × 467; 35 KB
- FIG. 19. Power generation for different reactor types in the BAU.png SHIROKIYD
13:56, 4 August 2020
652 × 483; 39 KB


