Uncategorized files
Jump to navigation
Jump to search
Showing below up to 50 results in range #51 to #100.
View (previous 50 | next 50) (20 | 50 | 100 | 250 | 500)
- FIG. 3. Overview of the different tasks for definition of RD&D.png 614 × 343; 14 KB
- FIG. 4. Chain of decay of 238U (g amma emitters not marked) (1)..png 544 × 278; 29 KB
- FIG. 4. Historic demand and supply of uranium (13)..png 514 × 334; 73 KB
- FIG. 4. Uranium milling process (example of acid leaching).png 616 × 200; 12 KB
- FIG. 5..png 999 × 465; 50 KB
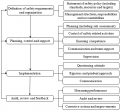
- FIG. 5. Components of safety management (35)..png 482 × 445; 21 KB
- FIG. 5. Elements of a waste minimization strategy (55).png 592 × 406; 20 KB
- FIG. 5. In-situ leaching process..png 572 × 366; 108 KB
- FIG. 5. The ALARP concept (21)..png 432 × 274; 18 KB
- FIG. 6. Flowchart of uranium refining and conversion..png 613 × 225; 14 KB
- FIG. 6. The concept of ALARP (71).png 472 × 301; 15 KB
- FIG. 7. Gas centrifuge process..png 590 × 450; 198 KB
- FIG. 8. Conventional PUREX process..png 589 × 189; 14 KB
- FIG. 8. Power production growth for BAU (a) and BAU&FR systems (b)..png 1,212 × 446; 34 KB
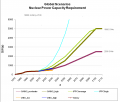
- FIG. 8. Scenarios for global nuclear power (27)..png 474 × 259; 57 KB
- FIG. 8 A NES with an open fuel cycle.png 477 × 131; 7 KB
- FIG 2. Overview of the different tasks for definition of RD&D..png 590 × 327; 14 KB
- Fig.1.png 548 × 346; 324 KB
- Fig.10.png 771 × 525; 539 KB
- Fig.11.png 771 × 495; 471 KB
- Fig.12.png 771 × 508; 66 KB
- Fig.13.png 771 × 508; 116 KB
- Fig.2.png 771 × 422; 553 KB
- Fig.3.png 771 × 210; 166 KB
- Fig.4.png 771 × 384; 522 KB
- Fig.5.png 771 × 508; 94 KB
- Fig.6.png 771 × 508; 75 KB
- Fig.7.png 771 × 508; 100 KB
- Fig.8.png 771 × 508; 88 KB
- Fig.9.png 771 × 508; 106 KB
- Fig. 1. SYNERGIES storyline.png 1,380 × 784; 178 KB
- Fig. 11. Ranking of the NES deployment scenarios..png 891 × 357; 37 KB


