Fissile/fertile materials: global supply and demand (Sustainability Assessment)
This page is the "Appendix I" to Environmental Impact from Depletion of Resources
This appendix presents a summary of the information generated in selected studies on global demand and
supply of uranium during the twenty-first century.
First, the global uranium supply documented in the Red Book 2011 [13] — a joint report by the OECD/NEA
and the IAEA published in 2012 — will be presented in some detail, covering fissile/fertile materials such as
uranium and thorium resources, uranium exploration and uranium production. This information will be compared
to the global uranium demand projected until 2035, and the supply and demand relationship will be discussed.
Second, the main results of an IAEA report [11] analysing uranium supply to 2050 will be briefly presented.
Third, an OECD study [26] will be briefly described that focuses on the sustainability of nuclear fuel cycles.
Finally, a brief summary of a WNA study [27] on the global nuclear fuel market is presented.
Contents
- 1 Global uranium supply and demand defined in the red book
- 1.1 Definition of resource categories
- 1.2 Definition of cost categories
- 1.3 Global conventional resources of uranium
- 1.4 Global unconventional global resources of uranium
- 1.5 Secondary supply of fissile material
- 1.6 Resources of thorium
- 1.7 Global exploration and production of uranium
- 1.8 Global demand for uranium defined in the Red Book
- 1.9 Balance of global uranium demand and supply in the Red Book
- 1.10 Conclusions based on the information in the Red Book
- 2 Analysis of uranium demand and supply to 2050 by the IAEA
- 3 Trends towards sustainability in the nuclear fuel cycle
- 4 Global nuclear fuel market: supply and demand 2013–2030
- 5 General conclusions
- 6 See also
Global uranium supply and demand defined in the red book
The Red Book 2011 [13] defines categories of uranium resources that could be mined (also called primary resources) based on confidence levels and costs to mine.
Definition of resource categories
The estimated uranium resources reported in the Red Book 2011 [13] are classified on the basis of confidence
levels in the quantities reported, and further separated into categories based on the cost of production.
Two broad classes of uranium resources to be mined are distinguished: conventional and unconventional.
Conventional resources are those that have an established history of production where uranium is a primary product,
co-product or an important by-product (e.g. from the mining of copper and gold). Very low grade resources or those
from which uranium is only recoverable as a minor by-product are considered unconventional resources.
Conventional resources are further divided, according to different confidence levels of occurrence, into
four categories: reasonable assured resources (RARs), inferred resources (IRs), prognosticated resources (PRs) and
speculative resources (SRs). RARs and IRs together are called identified resources and refer to uranium deposits
delineated by sufficient direct measurement to conduct feasibility or prefeasibility studies. PRs and SRs together
are called undiscovered resources and refer to uranium resources that are expected to exist based on geological
knowledge of previously discovered deposits and regional geological mapping.
Examples of unconventional resources of uranium are phosphate rocks, non-ferrous ores, carbonatite, black
shale and lignite. Additionally, sea water contains uranium, albeit at a rather low concentration of 3–4 parts per
billion (ppb).
There is also a classification scheme developed by the United Nations Economic Commission for Europe
called the United Nations Framework Classification for Fossil Energy and Mineral Resources 2009 (UNFC-2009).
UNFC-2009 is a generic principle based system in which quantities are classified on the basis of the three
fundamental criteria of economic and social viability (E), field project status and feasibility (F) and geological
knowledge (G), using a numerical coding system. Combinations of these criteria create a three dimensional
system [28]. UNFC-2009 is a project based system that applies to all fossil fuel energy and mineral reserves and
resources. It has been designed to meet, to the extent possible, the needs of applications pertaining to energy and
mineral studies, resource management functions, corporate business processes and financial reporting standards.
A bridging document between the OECD/NEA–IAEA ‘Red Book’ uranium classification and UNFC-2009 was
published in late 2014 [29].
Definition of cost categories
The Red Book 2011 [13] defines four categories of costs in US dollars of uranium recovered at the ore
processing plant: <US $40/kgU, <US $80/kgU, <US $130/kgU and <US $260/kgU (kgU = kilograms of uranium).
In the following sections, the global resources of uranium and thorium are presented as defined in the Red
Book 2011 [13].
Global conventional resources of uranium
Table 1 shows the conventional resources, as of 2011, for the four categories, namely RARs, IRs, PRs and SRs, in the four cost categories defined above. As mentioned previously, the sum of RARs and IRs is also called identified resources.
| Type of global uranium resources | Cost category | |||
|---|---|---|---|---|
| <US $40/kgU | <US $80/kgU | <US $130/kgU | <US $260/kgU | |
| RAR | 493 | 2014 | 3455 | 4378 |
| IR | 187 | 1063 | 1871 | 2717 |
| PR | – | 1624 | 2698 | 2841 |
| SR | – | – | 3543 | 7595* |
| Total | 680 | 4701 | 11 567 | 17 531 |
Note: IR: inferred resource; PR: prognosticated resource; RAR: reasonable assured resource; SR: speculative resource; tU: tonnes of natural uranium.
* - Includes resources with unassigned cost ranges.
Thus, as of 2011, the total global conventional resources of uranium that can be mined with production costs
below US $260/kgU were reported to be ~18 × 106 t and the identified resources were ~7 × 10⁶ tU. The Red
Book 2011 [13] further lists these resources separately for individual countries and different production methods.
Global unconventional global resources of uranium
As stated above, unconventional resources of uranium are contained in phosphate rocks, non-ferrous ores,
carbonatite, black shales and lignite. As of 2011, the reported unconventional global resources in these geological
formations were 7.3 × 10⁶–8.0 × 10⁶ tU, mainly in Morocco. However, not included in this value are the large
uranium resources associated with the Chattanooga (USA) and Ronneburg (Germany) black shales, which together
contain a total of 4.2 × 10⁶ tU. Total unconventional uranium resources (primarily in phosphates) are estimated
at up to 22 × 106 tU. Costs to recover these resources have a significant uncertainty and cover a wide range
of <US $40/kgU up to >US $260/kgU.
Sea water is also regarded as a possible source of uranium due to its large amount of contained uranium,
i.e. over 4 × 10⁹ tU in total, but at a low concentration of ~3 ppb. However, the costs of extracting uranium from
sea water are defined with a high uncertainty, and are estimated to be in the range US $200/kgU to US $700/kgU.
Secondary supply of fissile material
Table 1 listed the amount of conventional resources of uranium and previous Section gave the unconventional
resources of uranium. These categories of fissile and fertile materials are called primary resources.
In addition to primary resources, there is also secondary supply of fissile material based on mined and
processed uranium as discussed below.
Depleted uranium
The global amount of depleted uranium from enrichment of natural uranium was estimated by the Red
Book 2011 [13] to be ~1.6 × 10⁶ t. This corresponds to an equivalent amount of natural uranium of ~450 × 103 tU.
Inventories of uranium
The Red Book 2011 [13] estimated that 560 × 103 t of natural uranium and ~34 × 103 t of low enriched
uranium (LEU) are stored in commercial (utilities) and national inventories.
Highly enriched uranium
Several programmes have been performed by the Russian Federation and the USA to downgrade HEU
(weapons grade uranium) to LEU for commercial power (and research) reactors. In one programme, ~500 t of
HEU from the Russian Federation are to be converted into 14 × 103 t of LEU in the USA. Another programme will
convert ~300 t of HEU from the USA into ~8.4 × 10³ t LEU available for commercial reactors.
Reprocessed uranium
Owing to the rather high costs of production of fuel with REPU, there is currently no significant activity in
this area other than in France, with an annual generation of ~1 × 10³ t. The amount of stored REPU is not reported
in the Red Book 2011 [13].
Plutonium from reprocessing of spent fuel
France has a production of mixed oxide (MOX) fuel of ~200 t/a. Japan plans to install a comparable capacity
of MOX fuel production.
Plutonium from military programmes
An amount of ~70 t of military plutonium is planned to be converted into MOX fuel. The 70 t of plutonium
corresponds to an equivalent amount of natural uranium of ~15 × 103 t.
Spent nuclear fuel
Approximately 240 × 103 t of spent nuclear fuel (SNF) has currently been accumulated worldwide, and
~10 × 103 t are added every year [30] by the current size of the reactor fleet of ~370 GW(e) installed capacity. This
SNF contains more than 98% fissile/fertile materials that can be recycled into nuclear fuel.
Summarizing the information on secondary supply above, the amount of fissile material available from
military programme conversion of weapons grade material is expected to decrease after 2013. However, depleted
uranium and SNF are potential resources of fissile material that could satisfy the global nuclear fuel demand for
several decades in a thermal reactor fleet and practically infinitely in the case of an FR fleet.
Resources of thorium
Like uranium, thorium can be used as a nuclear fuel. Although it is not fissile itself, when loaded into a
nuclear reactor, 232Th absorbs neutrons to produce 233U, which is fissile (and long lived). Much of the 233U will
then fission in the reactor. The used fuel can then be unloaded from the reactor, and the remaining 233U can be
chemically separated from the thorium and used as fuel for another reactor.
Thorium’s global abundance is between three and five times that of uranium. It is found in four distinct types
of thorium deposits. In decreasing order of importance, these are carbonatite hosted, placer, vein type and alkaline
rock hosted. As of 2011, the total amount of global thorium resources was in the range 6.7 × 10⁶–7.6 × 10⁶ t.
A comprehensive IAEA report on the role of thorium to supplement fuel cycles of future NESs is available
(see Ref. [31]).
Global exploration and production of uranium
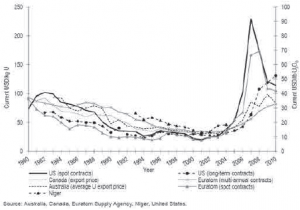
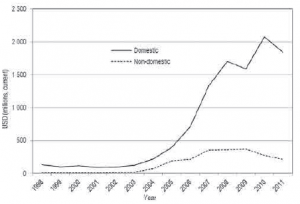
In 2010, the global expenditures on exploration and mine development totalled over US $2 billion. Generally, higher prices for uranium since 2003, compared to the preceding two decades, have stimulated increased explorations worldwide (see Figs 1 and 2).
Global production of uranium amounted to 54 670 tU in 2010. In situ leaching mining accounted for 39%, underground mining for 32%, open/pit mining for 23%, and co-product and by-product recovery from copper and gold operations for 6% of the total global production in 2010. The world uranium production capability using identified resources (RARs and IRs) recoverable at costs of up to US $130/kgU is expected to increase from 73 305 tU/a to 109 460 tU/a in 2035.
Global demand for uranium defined in the Red Book
At the beginning of 2011, there were 440 reactors in operation globally, with an electricity generating capacity
of ~375 GW(e) and a global demand for uranium of 63 875 tU/a. The corresponding world uranium production of
54 670 tU met ~85% of this world reactor demand. The remainder of the supply came from uranium already mined,
i.e. the so called secondary sources (see Section above), and included excess governmental and commercial
inventories, LEU produced from nuclear weapons, re-enrichment of depleted uranium tails and MOX fuel from
spent fuel reprocessing. This secondary supply is expected to decline somewhat after 2013.
The future demand for uranium in the Red Book 2011 [13] is based on two forecasts for the year 2035:
a low case with an increase of global nuclear capacity from 375 GW(e) up to 540 GW(e), and a high case with
an increase up to 746 GW(e). World reactor related uranium production requirements by the year 2035 (assuming
an enrichment tails assay of 0.30%) are projected to increase to a total of between 97 645 tU/a in the low case
and 136 385 tU/a in the high case, representing increases of ~50% and ~110%, respectively, compared to
2011 production requirements.
Accumulated total uranium requirements are estimated to be ~2.5 × 10⁶ tU and ~2 × 106 tU by 2035, for the
high and low cases, respectively. This means that only 35% of identified resources (7 × 10⁶ tU, RARs plus IRs)
would be consumed by 2035 in the high case, and only 29% in the low case.
Balance of global uranium demand and supply in the Red Book
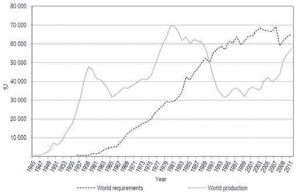
Figure 3 shows the historic demand and supply of uranium starting from 1945 until 2011, and indicates that at the start of nuclear power until about 1991, natural uranium production surpassed uranium consumption (demand). This enabled buildup of national and commercial inventories of natural uranium that are part of the so called secondary uranium supply. The deficit between production and demand after 1991 was mitigated by the drawdown of these inventories and other secondary uranium supplies, such as conversion of HEU from military programmes into LEU (see Section above).
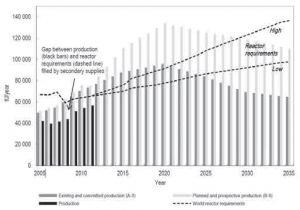
Figure 45 shows the predicted development of annual demand and supply of uranium from 2005 until the
year 2035 for the two scenarios of demand (high and low) presented in Section I.8.
Although Fig. 4 seems to suggest an oversupplied uranium market in the near term, i.e. until 2020 and
2025, for the high and low demand cases, respectively, experience shows that this is not likely to happen because
production capability is not actual production.
The gap between uranium production (black bars) and demand for reactor operation (dashed lines) from 2005
to 2010 has been met by drawing down secondary supply of uranium. This will also be the case in a reduced form
for the near future.
Figure 4 also indicates that timely investment in uranium production facilities will be necessary, taking
account of the long lead times to turn resources into production.
Conclusions based on the information in the Red Book
There exist sufficient uranium resources to support continued global use of nuclear power and for significant
growth in nuclear capacity up to 2035 and beyond. In the high growth scenario (746 GW(e)), only 2.5 × 10⁶ tU,
i.e. 35% of the identified resources (RARs plus IRs), of the 7 × 10⁶ tU would be consumed by 2035, and only
2 × 10⁶ tU, i.e. 29%, in the low growth scenario (540 GW(e)).
The known, conventional resources (RARs plus IRs plus PRs plus SRs) of ~18 × 106 tU would be sufficient
to continuously supply the current necessary annual amount of uranium ~70 × 103 tU/a of the current global NES
for about 300 years.
The total resource base reported in 2011 — conventional plus unconventional resources of ~40 × 106 tU —
is more than adequate to meet the projected growth requirements to 2035 in the low and high case scenarios.
However, timely investment is necessary to convert reported uranium resources (phosphates) into production
facilities.
If uranium resources in sea water — estimated to be more than 4 × 10⁹ tU — become available, it would lead
to practically inexhaustible resources.
History (Fig. 1) has also shown that as soon as uranium prices start to increase (because of predicted
shortages), uranium exploration will also increase (Fig. 2), and therefore enough uranium production will be
available in time for the operation of all nuclear reactors.
Analysis of uranium demand and supply to 2050 by the IAEA
The objective of the IAEA report Analysis of Uranium Supply to 2050 [11] (first published in 2001 and being updated in 2015 to cover a period up to ~2060) was to assess the adequacy of uranium resources to satisfy market based production demand and to characterize the level of confidence that can be placed in the projected supply. The study considered the uranium resources reported in the 2000 edition of the Red Book [32] and the International Institute for Applied Systems Analysis (IIASA)/World Energy Council (WEC) scenarios from Ref. [33] for evaluation of uranium demand and supply.
Projected growth of the global nuclear energy system to 2050
Three demand cases (low, middle and high) were considered in Ref. [11], covering a broad range of assumptions as to worldwide economic growth and related growth in energy and nuclear power up to the year 2050. In the low case scenario, the global installed nuclear capacity reached 333 GW(e), in the medium case, it reached 1132 GW(e), and in the high case, it reached 1805 GW(e), by 2050.
Projected demand for uranium by the global nuclear energy system to 2050
The cumulative uranium requirements between 2000 and 2050 for the three scenarios were projected as 3.39 × 10⁶ tU, 5.39 × 10⁶ tU and 7.58 × 10⁶ tU, respectively, for the low (corresponding to IIASA/WEC case C1 in Ref. [33]), middle (case C2 in Ref. [33]) and high (case A3 in Ref. [33]) demand cases.
Resources of uranium
The study (see Ref. [11]) used detailed information on primary and secondary supplies documented in the
Red Book 2000 [32] plus data based on evaluations carried out by the authors of the study.
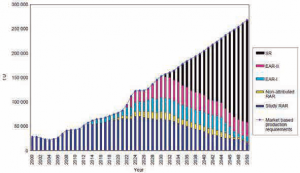
Figure 5 shows how different categories of uranium resources known in 2000 could be used to satisfy the
demand for annual production of uranium until 2050.
The model used in Ref. [11] to project production and resource adequacy presents a number of scenarios
including alternatives as to how the industry could evolve depending on specific conditions. According to the
study:
“The adequacy of resources to meet demand is measured in two ways. The first measure is a direct comparison of resources at different confidence levels with market based production requirements. The second measure takes into account the fact that not all resources will be utilized within the study period by comparing projected production with market-based requirements” [11].
Conclusions from the IAEA study to 2050
One conclusion of the study [11] was that uranium production from high confidence known resources was projected to be adequate to meet all requirements in the low demand case until 2050.
For the middle demand case, relatively high confidence known resources fell somewhat short of market
based production requirements from 2041 on. Conversely, if PRs were available, resources would exceed
requirements. However, if timing when production centres would be cost justified and the size of their resource
base was taken into account, the study predicted a shortfall of approximately 0.8 × 10⁶ tU. Considering prices,
lower cost (<US $130/kgU) conventional resources were not available to meet the uranium demand in the middle
and high demand cases, even when EAR-II (estimated additional resources as part of undiscovered conventional
resources) were taken into account. However, if very high cost (>US $130/kgU) conventional resources were taken
into account, together with unconventional resources, sufficient uranium supply may meet both the middle and
high demand cases, as the lower cost known resources would become exhausted. In addition, SRs may be explored,
which may include low cost resources. A condition is that significant and timely exploration of these SRs would
be undertaken (typically between 8 and 10 years are necessary from discovery to start of production, and 5 or
more years must be added for exploration and discovery and for the potential of completing even longer and more
expensive environmental reviews [34]).
Therefore, in a second conclusion, both the middle and high demand cases could be supplied by either rather
high cost conventional and unconventional resources, or by new lower cost conventional resource discoveries made
from SRs, although overconfidence should be avoided in yet undiscovered resources.
Trends towards sustainability in the nuclear fuel cycle
The OECD/NEA study published in 2011 [26] assessed trends in the nuclear fuel cycle over the past 10 years,
for the next 10 years and for the long term future. It focused on considerations of sustainability according to
the INPRO methodology covering aspects of environmental stressors, resource utilization, waste management,
infrastructure, proliferation resistance and physical protection, safety and economics.
In 2011, there were two types of commercial fuel cycles in use for management of irradiated (or spent)
nuclear fuel: the once through (or open) cycle, where the fresh fuel is used for one cycle in the reactor and then
treated as a waste to be disposed of, and a partially closed cycle where the spent fuel is reprocessed to recover
uranium and plutonium for recycling in fresh MOX fuel.
Based on the 2009 edition of the Red Book [35], uranium resources are expected to be sufficient for at least
another 100 years of supply (at 2008 reactor requirement levels), and production is expected to be more than
adequate to meet demand in the near term, provided that existing and committed plans of capacity expansion
are achieved in a timely manner. However, starting around 2000, uranium prices have generally increased and
become more volatile. The need for timely availability of natural uranium has become more important in terms of
security of supply for utilities and governments, as exemplified by the progressively longer term supply contracts,
the buildup of strategic stockpiles and the tendency of reactor suppliers to move into uranium mining in order to
secure supply and to hedge against the rising prices of natural uranium. These altered market conditions require
significant timely investment into exploration and building of uranium production facilities.
These conditions of the uranium market have led to continuous evolution of the fuel cycle technologies and
strategies driven mostly by the industry to optimize design and operation of reactors and their associated fuel cycle
facilities.
The trends regarding uranium resource utilization are either neutral or show improvements, especially for the
next decade. However, longer fuel cycles lead to less efficient resource utilization, and increased plant availability
increases the annual demand for uranium produced per GW(e) installed. The ongoing depletion of secondary supply
has led to a higher demand for primary resources, causing higher uranium prices, which, in turn, have stimulated
new exploration and commissioning activities. The study emphasizes that an increased use of MOX and REPU fuel
would significantly reduce the demand for new uranium resources to be developed.
Higher uranium and conversion prices have been detrimental to the economics of nuclear power, but the
overall effect on the competitiveness of nuclear energy has been small because fuel costs represent only a small
proportion of the overall electricity generating costs.
Global nuclear fuel market: supply and demand 2013–2030
In 2013, the WNA published a report [27] on the expected development of the global nuclear fuel market
to 2030.
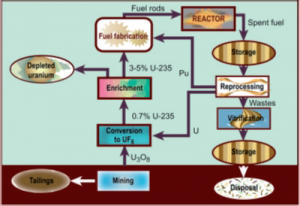
The study emphasized the complexity of a typical nuclear fuel cycle (see Fig. 6).
An important feature of the nuclear fuel cycle is the relatively low cost of transportation of uranium due
to its high energy density. Thus, mining, enrichment, fuel fabrication and use in a reactor is being carried out
economically in different countries.
Fuel costs in nuclear power have been a relatively minor element in total production costs compared to the
costs of fossil fuel in generating electricity. Nuclear fuel costs are usually below 20% of the total production costs,
whereas fossil fuel costs can be up to 80% of the total.
Production of uranium from primary resources has recently not covered more than 60–80% of the annual
demand. The remaining amount of uranium has been supplied by secondary uranium sources, e.g. drawdown of
inventories, down blending of military uranium, etc. The contribution of secondary supply will continue over the
entire period to 2030.
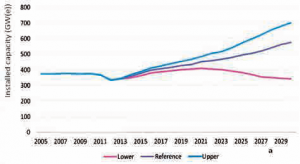
The WNA study considered three scenarios for growth of global nuclear power to 2030 (see Fig. 7): lower,
reference and upper.
The global nuclear capacity was assumed to reach 574 GW(e) in the reference scenario, to reach 700 GW(e)
in the upper scenario and to remain approximately at the current level of 340 GW(e) in the lower scenario by 2030.
In addition to these global scenarios for every country with an existing or planned nuclear power programme,
the predicted growth of national nuclear capacity was documented in the study.
To determine the necessary supply of uranium for the predicted scenarios, several factors of NES operation
have to be taken into account. For example, an increase of power plant load factor or reactor cycle length leads to
a higher specific demand for natural uranium (tU per GW(e)). A decrease of enrichment tails assay and an increase
of fuel burnup results in a lower specific demand. However, in the case of higher burnup, higher enrichment would
usually be necessary, which would lead to a higher demand.
The study presents detailed information on secondary sources of uranium available on the market.
For example, the amount of spent fuel mostly stored at reactor sites amounts to almost 2 × 10⁵ t (equivalent
to ~4 × 10⁵ tU). Depleted uranium has accumulated to over 1.5 × 10⁶ t (by content of 235U, it is equivalent to
~4.2 × 10⁵ tU).
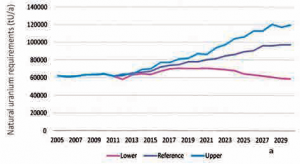
Figure 8 shows the annual production of uranium that is needed to fuel the global reactor fleet in the three
scenarios selected. In the reference scenario, an annual production of uranium of 9.7 × 10⁴ tU/a is needed by
2030, in the upper scenario, it is 1.2 × 10⁵ tU/a, and in the lower scenario, it is 5.9 × 10⁴ tU/a. These global figures
are based on country specific values for load factors, cycle length, enrichment, burnup, etc. (and also on global
assumptions, e.g. global tails assays are 0.22% of 235U).
For defining the available global resources of uranium, the study used the information presented in the Red
Book 2011 [13] that defined a total value of identified (RARs plus IRs) uranium resources of 7.1 × 10⁶ tU with
production costs lower than US $260/kgU. The Red Book 2011 also defined a world total of ~18 × 106 tU, including
less well proven resources termed PRs and SRs.
To estimate the future worldwide production of uranium until 2030, the study differentiated between the
current capacity of mines that are already in operation, mines under development for which development decisions
have been made, planned mines for which a feasibility study has been completed, and prospective mines that
have been publicly announced but which require further commercial analysis. Based on the growth scenarios of
nuclear power, three scenarios for the future uranium production (reference, upper and lower) were developed,
with different assumptions regarding delays of startup of mines and capacity.
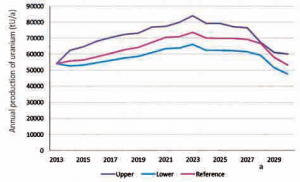
Figure 10 shows the expected global annual production of uranium, combining the information from each
country with known uranium resources. In 2030, the expected annual production of uranium reaches values of
6 × 10⁴ tU/a, 5.3 × 10⁴ tU/a and 4.7 × 10⁴ tU/a, according to the upper, reference and lower scenarios, respectively.
Comparing Fig. 9 with Fig. 8 indicates that there are not sufficient supplies expected for the reference
and upper scenarios from mining primary uranium resources. This gap could be closed by exploration and
commissioning of new mines and use of secondary uranium supplies.
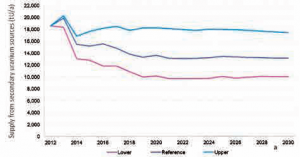
Figure 10 shows the results for expected supply by secondary sources. Again, different assumptions have
been made for the availability of secondary sources. In the reference case, secondary supply is expected to decline
from 2 × 10⁴ tU/a to 1.5 × 10⁴ tU/a after 2013, reaching a value of ~1.3 × 10⁴ tU/a in 2030; in the upper case, the
supply decreases to ~1.7 × 10⁴ tU/a in 2014 and by 2030 remains at the same level; in the lower case, the supply
decreases to 1.3 × 10⁴ tU/a after 2013 and reaches a value of ~1 × 10⁴ tU/a in 2030.
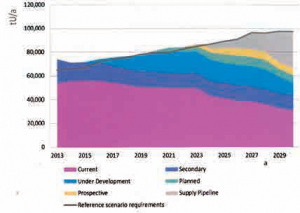
A comparison between predicted total annual supply of uranium by primary resources and secondary sources with the demand for uranium is presented in Fig. 11 for the reference scenario.
The graph shows some oversupply in the earlier years, then supply and demand are very much in balance up
to 2030. However, at that time, a substantial number of additional mines will be needed. As outlined in the study,
the market will be able to satisfy the demand by raising supply because the known resources of uranium are clearly
sufficient.
The study [27] also looked in detail at the situation regarding demand and supply of conversion, enrichment
and fuel production facilities. It concluded that for the near term, the existing and planned conversion and enrichment
capacities are sufficient, but significant additions will be needed close to 2030. Regarding fuel production, the
market is saturated, i.e. there is more than sufficient supply.
General conclusions
The uranium resource base and production capacity described in the publications summarized above
(additional examples with global scenarios of uranium supply and demand can be found in Refs [33, 35–39]; for
regional scenarios, see e.g. Refs. [40, 41]), i.e. the Red Book 2011 [13], the IAEA report Analysis of Uranium
Supply to 2050 [11], the OECD/NEA study Trends Towards Sustainability in the Nuclear Fuel Cycle [26] and the
WNA study The Global Nuclear Fuel Market [27], is more than adequate to meet projected uranium requirements
for the foreseeable future, i.e. up to 2050, even in the case of substantial growth of nuclear power. Taking all
conventional and unconventional resources of uranium into account, the resource base amounts to ~4 × 10⁷ tU.
Consideration of the potential resources of uranium in sea water of more than 4 × 10⁹ tU makes uranium supply
practically unlimited.
However, favourable market conditions are required for known uranium resources to be developed into
production facilities in time to meet the projected uranium demand up to 2050, and even more so until the end of
the century. This is a plausible scenario, because the history of the last few decades has shown that when uranium
prices increase because of predicted shortages, the market will react appropriately, and the necessary uranium
production capacity will be realized in time, via increased exploration.
It is important to note that the cost of uranium does not influence significantly the economic competitiveness
of nuclear power because its contribution is ~5% of the total production cost of electricity; the main contributors
are capital cost (~60%) and maintenance and operation costs (~20%), and the total fuel costs (mining, conversion,
enrichment and fuel production) are 15% of the electricity production cost. Thus, large increases in the cost of
uranium mined can be tolerated within the nuclear power market.
See also
- Appendix II
- Appendix III
