Help
Uploads by SHIROKIYD
Jump to navigation
Jump to search
This special page shows all uploaded files.
File list
Items per page:
20
50
100
250
500
Search for media name:
Username:
Include old versions of files
Go
First page
Previous page
Next page
Last page
Date
Name
Thumbnail
Size
Description
Versions
12:13, 24 August 2020
KIND. Unnamed 2.png
(
file
)
126 KB
1
12:03, 24 August 2020
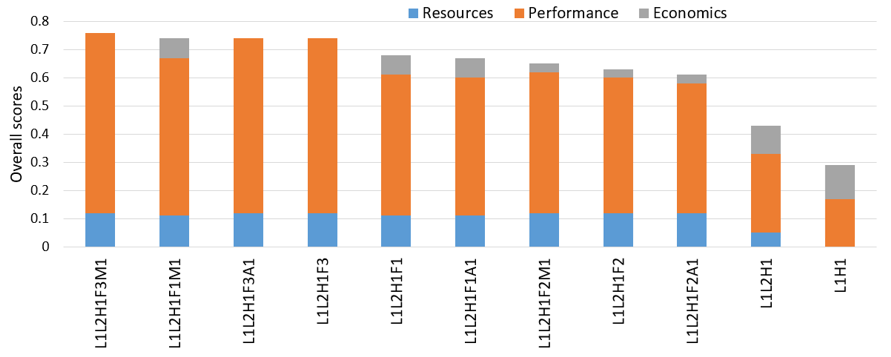
Fig. 12. Performance and ranking results for advanced NFC options..png
(
file
)
713 KB
1
12:01, 24 August 2020
Fig. 11. Ranking of the NES deployment scenarios..png
(
file
)
37 KB
new
1
10:15, 24 August 2020
Fig. 10. Sensitivity analysis for NES and CPP performed by varying the acceptability weighting factor..png
(
file
)
36 KB
1
10:15, 24 August 2020
Fig. 9. Ranking results for comparative evaluation of an NES and a CPP (base case)..png
(
file
)
16 KB
1
10:13, 24 August 2020
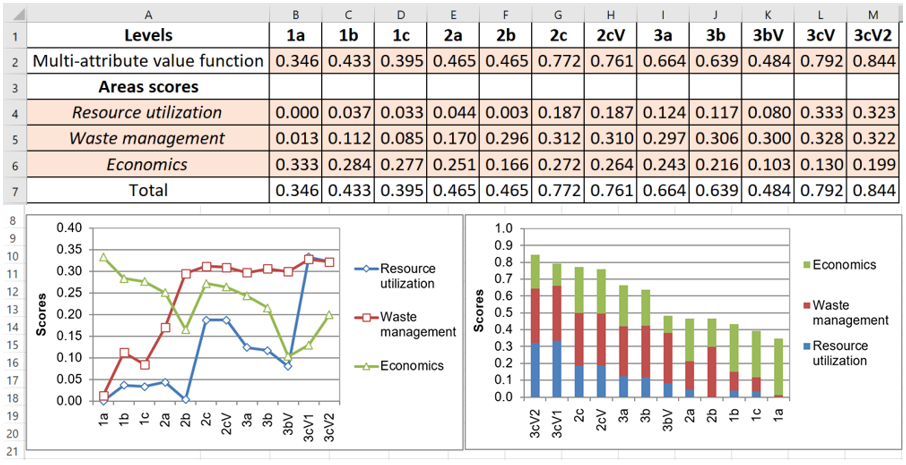
Fig. 8. High level objectives (HLO) scores for- (a) case 1; (b) case 2; (c) case 3..png
(
file
)
83 KB
1
10:12, 24 August 2020
Fig. 7. Structure of the objectives tree in the case study from Romania..png
(
file
)
52 KB
1
10:09, 24 August 2020
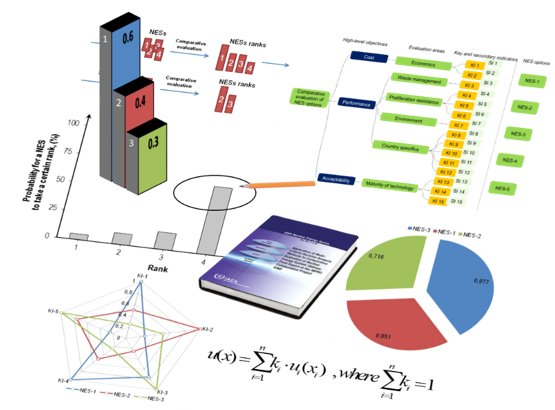
Fig. 6. Outputs of KIND-ET (example)..png
(
file
)
215 KB
1
10:08, 24 August 2020
Fig. 5. Inputs of KIND-ET (example)..png
(
file
)
106 KB
1
10:06, 24 August 2020
Fig. 4. Schematics of the objectives tree..png
(
file
)
133 KB
1
10:03, 24 August 2020
Fig. 3. Flowchart of MCDA application..png
(
file
)
115 KB
1
09:59, 24 August 2020
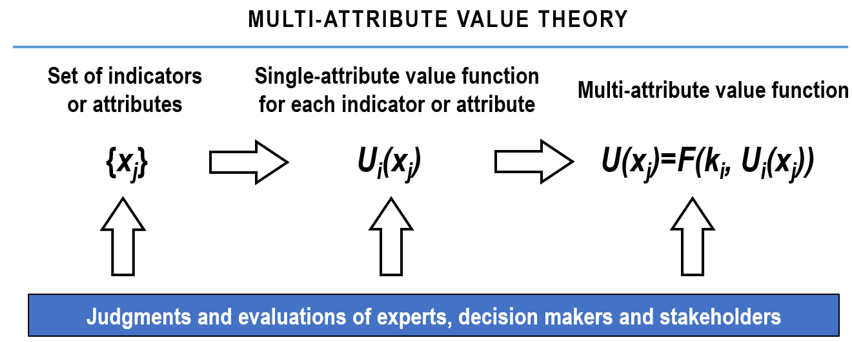
Fig. 2. Schematics of MAVT..png
(
file
)
55 KB
1
09:58, 24 August 2020
Fig. 1. Scope (a) and schematics (b) of multi-criteria decision analysis..png
(
file
)
145 KB
1
09:56, 24 August 2020
KIND.Unnamed.png
(
file
)
119 KB
1
09:34, 24 August 2020
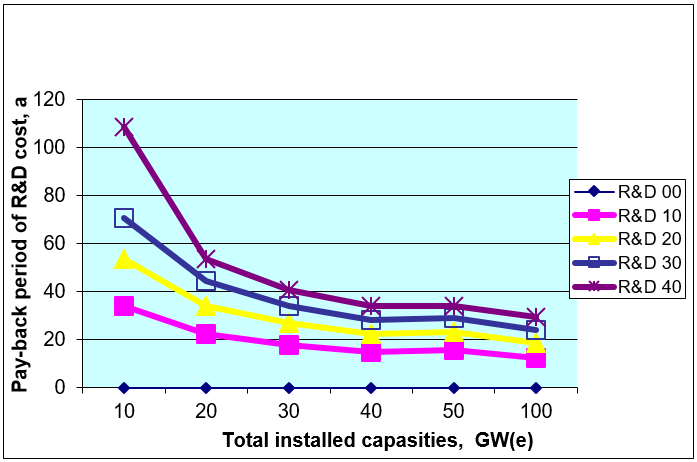
FIG. 13. Pay-back period for R&D cost for the innovative nuclear energy system for different installed capacities..png
(
file
)
30 KB
1
09:25, 24 August 2020
FIG. 12. Plutonium in short-term cooled SNF for the moderate GAINS scenario..png
(
file
)
44 KB
1
09:23, 24 August 2020
FIG. 11. Potential for fast reactor deployment..png
(
file
)
55 KB
1
09:21, 24 August 2020
FIG. 10. Cumulative amounts of spent fuel in BAU(a) and BAU&FR (b) systems for the high GAINS scenario..png
(
file
)
43 KB
1
09:18, 24 August 2020
FIG. 9. Cumulative natural uranium demand in BAU (a) and BAU&FR (b) systems for the high GAINS scenario..png
(
file
)
72 KB
1
09:15, 24 August 2020
FIG. 8. Power production growth for BAU (a) and BAU&FR systems (b)..png
(
file
)
34 KB
1
14:13, 21 August 2020
FIG. 7. Flow chart for a combined once-through cycle and fast reactor closed fuel cycle system.png
(
file
)
66 KB
1
14:00, 21 August 2020
FIG. 6. Variation in technical maturity for reactor designs in the GAINS database.png
(
file
)
988 KB
1
13:52, 21 August 2020
FIG. 5..png
(
file
)
50 KB
1
13:50, 21 August 2020
FIG. 4. Heterogeneous models for future global nuclear fuel cycles..png
(
file
)
16 KB
1
13:48, 21 August 2020
FIG. 3. GAINS scenarios for modelling nuclear power generation (GWa values show actual electric power produced annually, not installed capacity)..png
(
file
)
51 KB
1
13:44, 21 August 2020
FIG. 2. Set of reactor and fuel types with deployment time frames..jpg
(
file
)
141 KB
1
13:41, 21 August 2020
FIG.1. 5th Meeting of the INPRO Collaborative Project GAINS, 27 May 2010..jpg
(
file
)
242 KB
1
13:17, 21 August 2020
ASENES Menu.png
(
file
)
183 KB
3rd block changed
2
12:41, 21 August 2020
Fig. 18. Pu and MA inventories in disposal facilities at the end of scenario cycle..png
(
file
)
38 KB
1
12:39, 21 August 2020
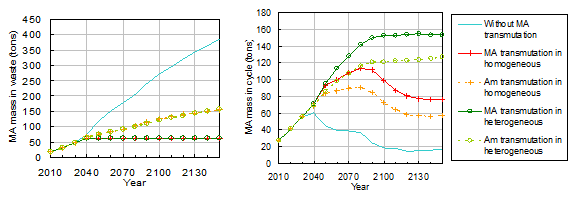
Fig. 17. Reduction of minor actinides (MA) in the waste and increase of the inventory of minor actinides in the fuel cycle in scenarios with transmutation of minor actinides..png
(
file
)
17 KB
1
12:38, 21 August 2020
Fig. 16. The minimum required averted disposal costs of HLW for each storage duration and REPU enrichment..png
(
file
)
16 KB
1
12:37, 21 August 2020
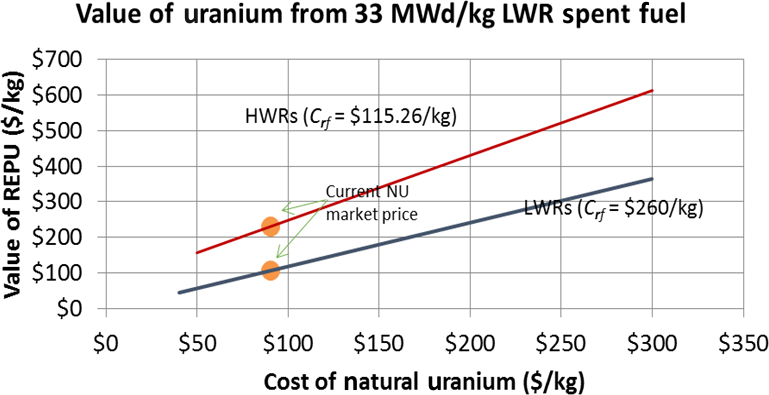
Fig. 15. The value of reprocessed uranium as a function of the cost of natural uranium, with fabrication costs held fixed.png
(
file
)
75 KB
1
12:36, 21 August 2020
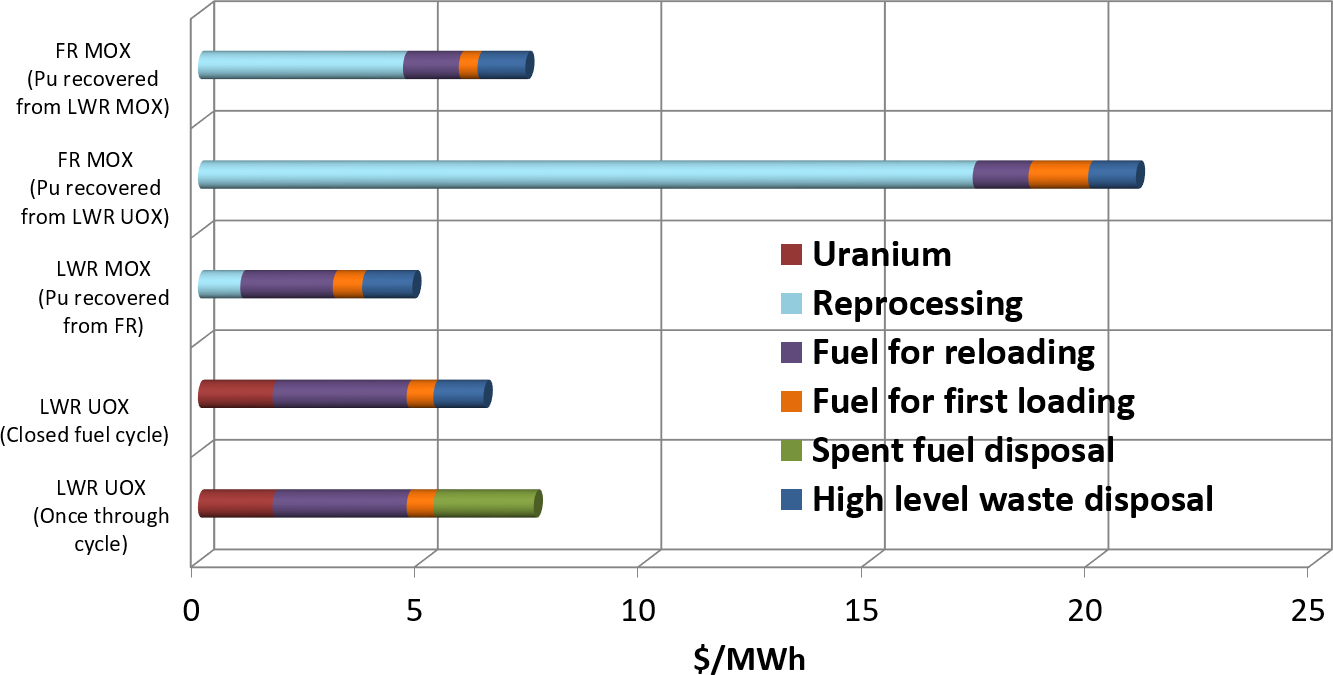
Fig. 14. Levelized fuel cycle unit costs..png
(
file
)
63 KB
1
12:35, 21 August 2020
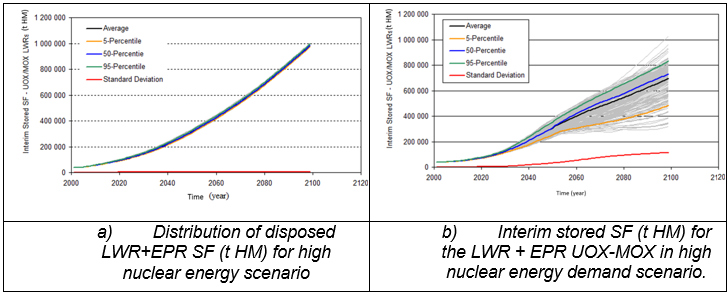
Fig. 13. Long term storages of LWR SNF in NG1 (synergistic case).png
(
file
)
66 KB
1
12:34, 21 August 2020
Fig. 12. Back end synergistic case in the global scenario..png
(
file
)
154 KB
1
12:33, 21 August 2020
Fig. 11. Russian scenario- (a) First step, (b) Second step (in the case of a high energy demand), (c) Second step (in the case of energy demand stabilization)..png
(
file
)
12 KB
1
12:33, 21 August 2020
Fig. 10. French scenario- (a) First step, (b) Second step of transition to the NES based on closed nuclear fuel cycle..png
(
file
)
8 KB
1
12:30, 21 August 2020
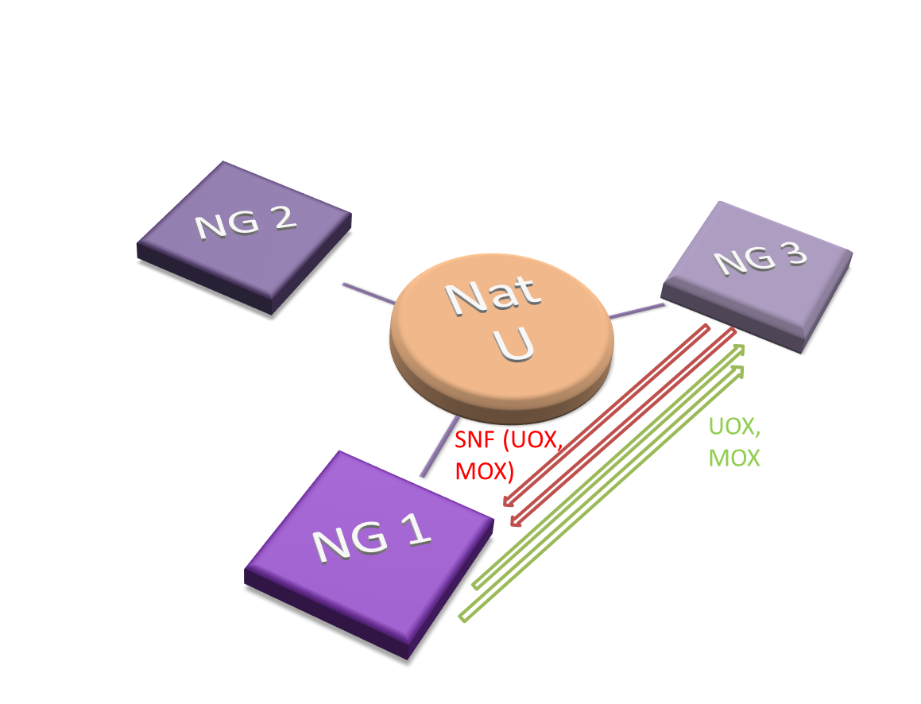
Fig. 9. Scheme of regional collaboration on spent nuclear fuel utilization..png
(
file
)
101 KB
1
12:29, 21 August 2020
Fig. 8 Comparison of the amounts of spent nuclear fuel in interim storage in the two EU27 scenarios..png
(
file
)
65 KB
1
12:15, 21 August 2020
Fig. 7e SYNERGIES.png
(
file
)
188 KB
1
12:15, 21 August 2020
Fig. 7d SYNERGIES.png
(
file
)
167 KB
1
12:15, 21 August 2020
Fig. 7c SYNERGIES.png
(
file
)
131 KB
1
12:14, 21 August 2020
Fig. 7b SYNEGRIES.png
(
file
)
172 KB
1
12:10, 21 August 2020
7a.png
(
file
)
101 KB
1
10:08, 21 August 2020
Fig. 6 Cumulative spent fuel accumulation in two scenarios..png
(
file
)
82 KB
1
10:07, 21 August 2020
Fig. 5. Fresh fuel annual requirements (left) and cumulative spent fuel in storages (right)..png
(
file
)
74 KB
1
10:02, 21 August 2020
Fig. 4. CAREM - small PWR reactor of Argentinian design of 25 MWe capacity..jpg
(
file
)
145 KB
1
09:59, 21 August 2020
Fig. 3. Nature of synergies within the SYNERGIES storyline (the lower bar shows the degree of technological readiness in conventional units (18))..png
(
file
)
90 KB
1
09:53, 21 August 2020
Fig. 2. Overall view of the considered synergies among the technologies..png
(
file
)
180 KB
1
09:49, 21 August 2020
Fig. 1. SYNERGIES storyline.png
(
file
)
178 KB
1
First page
Previous page
Next page
Last page
Navigation menu
Personal tools
Log in
Namespaces
Special page
Variants
Views
More
Search
Navigation
Main page
Recent changes
Random page
Help about MediaWiki
Tools
User contributions
Logs
View user groups
Special pages
Printable version


..png)
_scores_for-_(a)_case_1;_(b)_case_2;_(c)_case_3..png)

..png)
..png)


_and_schematics_(b)_of_multi-criteria_decision_analysis..png)


_and_BAU%26FR_(b)_systems_for_the_high_GAINS_scenario..png)
_and_BAU%26FR_(b)_systems_for_the_high_GAINS_scenario..png)
_and_BAU%26FR_systems_(b)..png)


.png)


_and_cumulative_spent_fuel_in_storages_(right)..png)

)..png)


..png)
_in_the_waste_and_increase_of_the_inventory_of_minor_actinides_in_the_fuel_cycle_in_scenarios_with_transmutation_of_minor_actinides..png)
_First_step,_(b)_Second_step_(in_the_case_of_a_high_energy_demand),_(c)_Second_step_(in_the_case_of_energy_demand_stabilization)..png)
_First_step,_(b)_Second_step_of_transition_to_the_NES_based_on_closed_nuclear_fuel_cycle..png)